FINDINGS
The most obvious indicators regarding a correlation between either solar electromagnetic or geomagnetic activity and tornadoes would be most easily statistically observed by studying history’s F4 and much more uncommon F5 tornadoes. World-class record keeping and the fact that Tornado Alley is by far the most tornadic12 area on the planet make it the world’s best place for studying tornadoes.
Many F4 and F5 tornadoes have also touched down outside of Tornado Alley but all in the research period manifested east of the Rocky Mountains. All have been included in an attempt to form a comprehensive list of all F4 and F5 events in the US from 1958 to 3/2019 (61.25 years.)
F4/F5 EVENTS 1958 – 3/2019
- Refer to Appendix A: F4 and F5 Tornadic Events in the United States 1958-3/2019
Total F5s between 1958 – 3/2019: at least 51
Total F4s between 1958 – 3/2019: at least 475
GEOMAGNETIC ANOMALIES 1958-2007 AND 12/2015-3/3/201913
Geomagnetic anomalies are measured via the Disturbance storm-time14 (Dst) index: a nanotesla measurement of the context of high altitude (space) weather – the strength of the Earth’s ring current. The ring current is electric and generated by the longitudinal drift of energetic particles: mostly protons with some electrons and alpha particles. Dst is a composite of two influences: the internal storm time (IST15) index contributed by secondary, interior fields and the external storm time (EST) index, which is about three times as powerful. If Earth were a perfect conductor, the two contributions would be nearly equal.
Negative deflection of Earth’s magnetic field – an opposing flowing relative to the earthly average – happens sporadically both chronologically and geographically. Simultaneously, other areas in the magnetic field may add to the net earthly current by moving with it.
Quantified by inferring its general movement, a prominently weakened Dst, which is observed during solar electromagnetic storms, represents a reduction in the intensity of the horizontal component16 of the magnetic field. A moderate solar electromagnetic storm registers between -50 and -100 nanotesla. An intense storm ranges from -101 to -250 nT. Anything lower than -250 nT is classified as a super-storm. For a frame of reference, observers of 1989’s event around Quebec reported a minimum Dst of -589 nT. The Carrington Event produced a local reading of approximately -800 to -1750 nT.
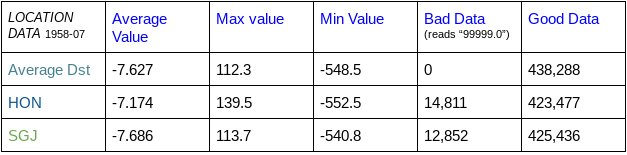
Archived hourly data17 at the midlatitude research stations Honolulu (HON) [21.307°N, 157.858°W], Kakioka (KAK) [36.242°N, 140.194°E], Alibag (ABG) [18.655°N, 72.867°E], Hermanus (HER) [34.409°S, 19.250°E] and San Juan (SJG) [18.466°N, 66.106°W] from 1958-2007 is publicly available, as well as interactive data starting in the middle of 201518.
There are some patterns to earthly Dst readings. High-speed plasma streams from coronal holes generate electromagnetic storms roughly every twenty-seven days. The largest solar electromagnetic storms tend to occur just after the equinoxes. Minima are most frequent just after the solstices. The delays are due to the characteristic hemispherical asymmetry of solar winds. Diurnal variation is typical, with the greatest disturbance storm-time at dusk and the smallest at dawn by roughly +- 19%.
Tabulations on the 1958-2007 data set were performed using specially built Python computer programs. Typical Dst values were between -7 and -8. The highest in the data set approaches 140, while the lowest drops below -550. Although presently impossible to definitively declare, the average Dst value may very well be closer to zero given hundreds to thousands of years of additional data.
- Refer to Appendix B: F4 and F5 Tornadic Events and Contemporary Geomagnetic Data
Total F5s between 1958 – 2007 and 12/2015 – 3/2019: at least 39
Total F4s between 1958 – 2007 and 12/2015 – 3/2019: at least 414