

Meteorologist
Geoff Linsley
Dedicated to my late niece, Alexis Victoria Jones (6/25/96-1/30/19.)
Special thanks to Alex Pesch for his lifelong friendship
and secondarily his conveniently valuable expertise in big data.
© May 2019 by Meteorologist Geoff Linsley
All rights reserved.
ABSTRACT
Relating observed solar and earthly electromagnetic changes to tornadic intensity in the US: is there a correlation? The first goal for this research is to tabulate the hourly timestamps of the storms from 1958-3/2019 that are known to have spawned tornadoes rated F4 and F5 on the Fujita scale. The second is to compare the events with USGS geomagnetic data and both quantify and illustrate possible correlations, which may help point toward genuine conclusions and inspire fruitful related future research.
If a non-coincidental correlation is confirmed, it may reveal a new forecast parameter for improving forecasting accuracy for the world’s strongest tornadoes, if not also general tornadic intensity or a previously hidden component of tornadogenesis. Altogether uncovered are five potentially new revelations about F4 and F5 tornadoes.
BACKGROUND: SOLAR ELECTROMAGNETIC AND GEOMAGNETIC STORMS
Several curious about the nature of earthly weather have postulated a correlation between solar electromagnetic or earthly geomagnetic disturbances and tornadogenesis. Real answers are now tangible due to the blessing of several decades of highly accessible historical data. A thorough examination of the influences of solar and earthly electromagnetic changes on F4 and F5 tornadoes must analyze the timestamps of both anomalous data during them and of known solar electromagnetic storms.
SOLAR ELECTROMAGNETIC STORMS
History’s biggest and most impactful solar electromagnetic storms, such as The Electric Storm of 18821, have been products of the inner turmoil of the sun. That storm was able to melt contemporary infrastructure: some of Western Union’s telegraph lines. The most notable, the 1859 Carrington Event2 – the “white light flare” that made night seem like day – helped to inspire early solar research. Another Carrington Event in 2019 would threaten far more than telegraph lines, potentially damaging on the order of $0.6-2.63 trillion dollars. The most famous of more recent storms struck on Mar. 3, 1989 in Quebec4, majorly disrupting eastern Canada while
casting an aurora visible from Texas.
Other, less notable incidents, such as the August 20185 geomagnetic storm and the Jul. 14, 2000 Bastille Day event6 , have disrupted satellites and terrestrial communications, occasionally triggering fires. Seventeen major flares inflicting minor damages spanned from Oct. 19 to Nov. 5, 2003 and was particularly shocking on Halloween7.
Although heightened solar activity is responsible for the frequency and sizes of electromagnetic storms, it is much less important than the very slight chance a flare projecting a storm into a precise point in space will hit earth squarely. For instance, another potential Carrington Event narrowly missed8 Earth in 2014.

Semi-regular, small-to-moderate electromagnetic storms correlate with sunspot activity. Typically, they take one to five days to reach Earth and often last six to twelve hours, although some last for days9. When a solar wind, a.k.a. solar cloud, reaches Earth, it compresses the magnetosphere and adds to the existing current. The compression drives atmospheric particles poleward. Molecular collisions with the lower atmosphere are witnessable as the aurora borealis (north) and australis (south.)
CHANGES IN OBSERVED GEOMAGNETIC DATA OVER TIME
A second, more thorough approach toward observing a possible correlation between tornadoes and electromagnetic fluctuations is to meticulously study the available electromagnetic anomaly data, which is dominated by earthly physics when the sun isn’t storming over Earth.
Why are Earth’s geomagnetic physical properties constantly changing? The prevailing theory concludes they’re mainly driven by moving channels of subterranean, molten iron. Deep in the core, the slow but persistent displacement changes the complicated shapes of Earth’s electromagnetic fields.
One way this manifests to an observer on the surface is the translation of the magnetic poles. The North Pole has drifted closer to true north – under an ice cap floating in the middle10 of the Arctic Ocean – rather than northern Nunavut, CA, as taught to 20th Century schoolchildren. Sometimes it travels faster than others. It’s not a new phenomenon: 19th Century scientists11 also detected its migration.
In the mid-1990s, the North Pole abruptly began to move not nine miles per year but around thirty-four. By 2018, it skipped over the International Date Line, into the Eastern Hemisphere. Two primary patches of magnetic fields dominate the north: one near Siberia and one near Canada. Presently, the Canadian influence is being suppressed. Do these changes potentially relate to the production of F4 and F5 tornadoes?
APPROACH
The United States Geological Survey (USGS) makes available electromagnetic anomaly data from midlatitude research stations: Honolulu (HON) [21.307°N, 157.858°W], Kakioka (KAK) [36.242°N, 140.194°E], Alibag (ABG) [18.655°N, 72.867°E], Hermanus (HER) [34.409°S, 19.250°E] and San Juan (SJG) [18.466°N, 66.106°W]. San Juan, Puerto Rico is by far the closest to the continental US, with Honolulu being the next best data source.
Solar electromagnetic and geomagnetic anomalies can affect the atmosphere through both direct radiative transfer and chemically via radiative transfer followed by displacement. The USGS data, however, is not air samplings from the research stations but rather latitude-weighted values. That means a prominent solar electromagnetic storm over Quebec, for example, will get averaged out by all the readings both north and south of the event and won’t seem nearly as significant if the bottom half of the planet is posting data high into the positives. An exceptionally low reading correlates to widespread very low readings rather than an isolated
event.
San Juan [18.466°N, 66.106°W] is by far the closest to Tornado Alley, yielding the most regionally accurate measurement. Tornado Alley – which has a rough coordinate matrix of Montgomery, AL [32.379°N, 86.308°W], Akron, OH [41.081°N, 81.519°W], Pierre, SD [44.367°N, 100.354°W] and Abilene, TX [32.449°N, 99.733°W] – is where almost all F4s and F5s in the US have touched down, although all in the timeframe will be included. From San Juan, those coordinates yield a distance matrix: [13.92°, 20.20°], [22.62°, 15.41°], [25.90°, 34.26°], [13.98°, 33.63°]. Honolulu is much farther away but is second closest, so it will also be observed, as well as the planetary average.
FINDINGS
The most obvious indicators regarding a correlation between either solar electromagnetic or geomagnetic activity and tornadoes would be most easily statistically observed by studying history’s F4 and much more uncommon F5 tornadoes. World-class record keeping and the fact that Tornado Alley is by far the most tornadic12 area on the planet make it the world’s best place for studying tornadoes.
Many F4 and F5 tornadoes have also touched down outside of Tornado Alley but all in the research period manifested east of the Rocky Mountains. All have been included in an attempt to form a comprehensive list of all F4 and F5 events in the US from 1958 to 3/2019 (61.25 years.)
F4/F5 EVENTS 1958 – 3/2019
- Refer to Appendix A: F4 and F5 Tornadic Events in the United States 1958-3/2019
Total F5s between 1958 – 3/2019: at least 51
Total F4s between 1958 – 3/2019: at least 475
GEOMAGNETIC ANOMALIES 1958-2007 AND 12/2015-3/3/201913
Geomagnetic anomalies are measured via the Disturbance storm-time14 (Dst) index: a nanotesla measurement of the context of high altitude (space) weather – the strength of the Earth’s ring current. The ring current is electric and generated by the longitudinal drift of energetic particles: mostly protons with some electrons and alpha particles. Dst is a composite of two influences: the internal storm time (IST15) index contributed by secondary, interior fields and the external storm time (EST) index, which is about three times as powerful. If Earth were a perfect conductor, the two contributions would be nearly equal.
Negative deflection of Earth’s magnetic field – an opposing flowing relative to the earthly average – happens sporadically both chronologically and geographically. Simultaneously, other areas in the magnetic field may add to the net earthly current by moving with it.
Quantified by inferring its general movement, a prominently weakened Dst, which is observed during solar electromagnetic storms, represents a reduction in the intensity of the horizontal component16 of the magnetic field. A moderate solar electromagnetic storm registers between -50 and -100 nanotesla. An intense storm ranges from -101 to -250 nT. Anything lower than -250 nT is classified as a super-storm. For a frame of reference, observers of 1989’s event around Quebec reported a minimum Dst of -589 nT. The Carrington Event produced a local reading of approximately -800 to -1750 nT.
Archived hourly data17 at the midlatitude research stations Honolulu (HON) [21.307°N, 157.858°W], Kakioka (KAK) [36.242°N, 140.194°E], Alibag (ABG) [18.655°N, 72.867°E], Hermanus (HER) [34.409°S, 19.250°E] and San Juan (SJG) [18.466°N, 66.106°W] from 1958-2007 is publicly available, as well as interactive data starting in the middle of 201518.
There are some patterns to earthly Dst readings. High-speed plasma streams from coronal holes generate electromagnetic storms roughly every twenty-seven days. The largest solar electromagnetic storms tend to occur just after the equinoxes. Minima are most frequent just after the solstices. The delays are due to the characteristic hemispherical asymmetry of solar winds. Diurnal variation is typical, with the greatest disturbance storm-time at dusk and the smallest at dawn by roughly +- 19%.
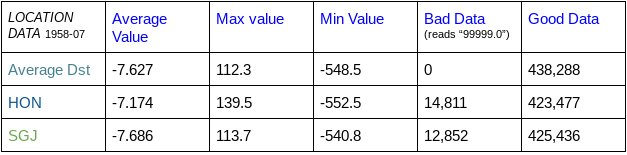
Tabulations on the 1958-2007 data set were performed using specially built Python computer programs. Typical Dst values were between -7 and -8. The highest in the data set approaches 140, while the lowest drops below -550. Although presently impossible to definitively declare, the average Dst value may very well be closer to zero given hundreds to thousands of years of additional data.

- Refer to Appendix B: F4 and F5 Tornadic Events and Contemporary Geomagnetic Data
Total F5s between 1958 – 2007 and 12/2015 – 3/2019: at least 39
Total F4s between 1958 – 2007 and 12/2015 – 3/2019: at least 414
ANALYZING THE DATA
Have history’s most famous solar electromagnetic storms correlated with history’s F4 and F5 tornadoes? The inquiry is easily answerable by analyzing the dates of the sampling of major solar electromagnetic events mentioned in the introduction: no F4 or F5 tornadoes were spawned during any events from 1958-3/2019. There may, however, be something valuable to find by analyzing the Dst during the exact hours of the F4 and F5 tornadic events.

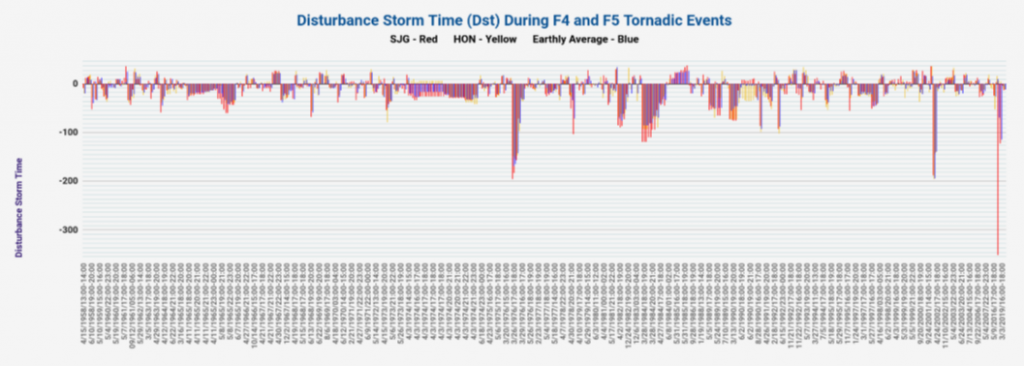

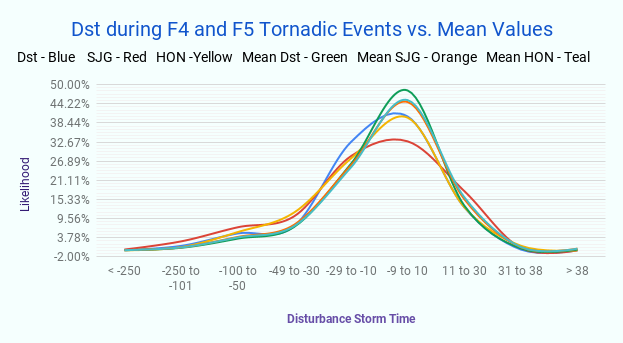
The results reveal a negative skew distribution, which is expected because the data set mean is around -7.5 Dst, the highest is 139.5 Dst and the lowest is -552.5 Dst.
The planetary average during an F4 or F5 tornado from 1958-2007 and 12/2015-3/2019 was -12.4 Dst. The average at HON was similar at -12.1 Dst. The average at SJG was -14.3 Dst: nearly twice as low as the data set mean value.


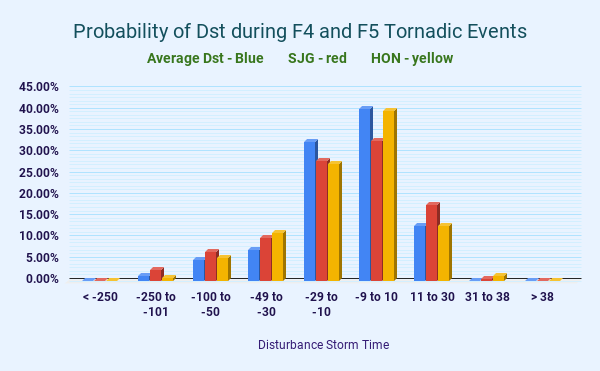
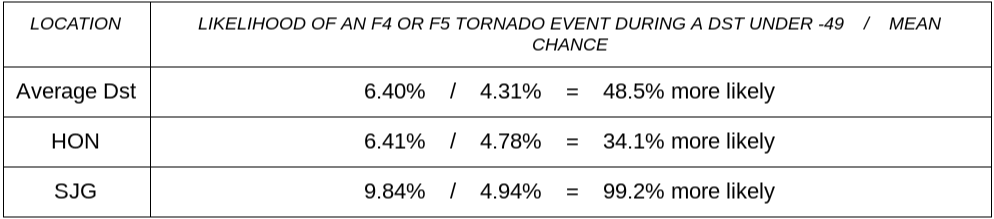
The chance of an electromagnetic anomaly under -49 Dst, indicative of moderate-to-severe solar electromagnetic storming or a moderate geomagnetic anomaly during F4 or F5 tornadic events, is about 30% higher at HON and about 50% higher on average across the planet. The latter figure exists because the chance is distinctly higher at SJG: a correlation 99.2% higher than the mean chance.

CONCLUSIONS
Have the biggest tornadoes in the US in recent history correlated with anomalous solar electromagnetic or geomagnetic activity? The data reveals five separate apparent conclusions.
SUPER-STORMS
Records do show that the F4 in Missouri during the Feb.-Mar. 2017 Tornado Outbreak19 registered at -352.3 Dst in SJG (representing 0.22% of its sample.) This particular event, however, was the only event on record to occur during a super-storm (SJG Dst under -250.) One piece of data is not enough to start drawing conclusions but it’s noteworthy that the chance of having one F4 or F5 tornado on any random day during the observation period [453 tornadoes / ((40 months + 600 months) * 24 hours)] is 0.097% but the odds of one having spawned in the observation period during a super-storm [0.22% data / 0.05% mean] was 340% higher than the data suggests is circumstantial.
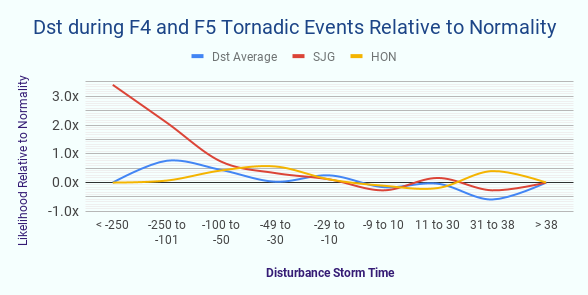
A DEPARTURE IN DST DURING F4/F5 EVENTS VS. THE MEAN
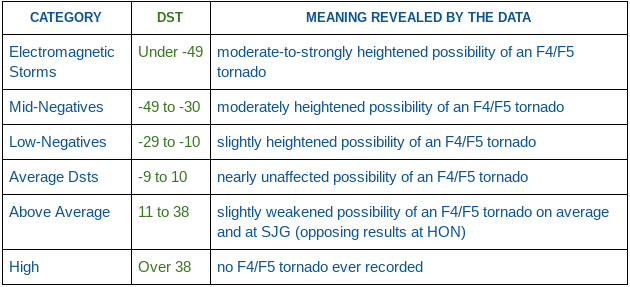
On average and at HON, there were fewer nearly average Dst readings during F4 and F5 events due to an increase in negative Dst readings. F4 and F5 tornadoes were generally more likely to occur during readings less than -10 Dst. Just under electromagnetic storm range, -30 to -49 Dst readings were 33% more likely at SJG. -29 to -10 Dst readings were about 11% more likely at SJG.
At SJG, hours during solar electromagnetic and geomagnetic storms below -49 Dst are much more commonly when F4 or F5 tornadoes spawn [1.992% (of the hours were below -49 Dst) * 0.097% (the odds of an F4/F5 tornado) = 0.193% (the likelihood of an F4/F5 tornado during an electromagnetic storm.)]
DST READINGS OVER 38
At times, Dst readings were well over 100 but this research reveals that none of the tornadoes formed when the Dst was over 38. If it’s more than a massive coincidence, it may denote a newly-discovered form of physical inhibition. About one in two hundred hours – 2.28% of the average year – reads over 38 Dst.
SOME DST READINGS ARE MORE INDICATIVE THAN OTHERS
Over 90% of Dst readings were within thirty of zero Dst. SJG was barely the exception in the group, in the mid-to-high eightieth percentile. Theoretically, the balances required to maintain a tornado may respond disruptively to values over 38, while fully tolerating more average values and favoring more locally negative Dst values. This pattern is indicative of tornadoes being an earthly phenomenon that gets influenced, rather than dependent on solar electromagnetic or geomagnetic disturbances. More negative values may serve as an electrochemical catalyst for the atmospheric composition of the largest tornadoes, greasing the skids for them, so to speak.
USING DST AS A WEATHER FORECASTING PARAMETER
As revealed by the data, Disturbance storm-time (Dst) may be a new, useful meteorological forecast parameter for, at least, F4 and F5 tornadoes, potentially uncovering one of perhaps many mysteries regarding why present models often struggle to predict when tornadic weather will transition from severe to catastrophic.

F4/F5 TORNADOES AND THE NORTH POLE
As seen in Appendix A, the recent historic lows of tornadic production relative to the 1950s-1970s, and to a lesser degree before the late-1990s, on its face is the opposite of concerning but it’s very noteworthy when considering how much more tornadic even typical conditions can be. This research helped to unveil that the most chronologically logical correlation has been the drifting of the North Pole, which suddenly kicked up its displacement 378% since the mid-1990s.
The only years with exceptional tornadic activity since the mid-1990s have been the historic El Niño year 1998 and April 201120 giant outbreak, followed by a similar outbreak21 just weeks later. Heightened tornadic activity is typical during a prominent El Niño, making 2011, which was record-breakingly tornadic, the only relatively considerable year since. While the correlation between the placement of the North Pole and F4/F5 tornadic production at this moment remains theoretical, the statistical correlation revealed by this research is eye-opening.
SUMMARY
This research reveals:
1) how Dst averages during each F4 and F5 event relate to data set averages
2) that F4 and F5 events are accompanied by a Dst almost twice as negative as average
3) that no tornadoes sized F4 or F5 formed during the observation period when over 38 Dst
4) SJG’s data is not necessarily but tends to be statistically more negative than the other research stations during F4 and F5 events east of the Rocky Mountains; and is nearly twice as likely to see an F4/F5 tornado during a solar electromagnetic storm or an abnormally prominently negative geomagnetic storm
5) F4 and F5 tornadoes are far less common now than between the late-1950s and mid-1990s, which is heavily statistically related to the presently distancing migration of the North Pole
POSSIBLE SUPPLEMENTARY RESEARCH
Conducting this research revealed several potential pathways for supplementary research. This section is primarily for readers interested in helping to study the topics covered.
Otherwise identical research with this study’s tornadic hourly data may be conducted using Kyoto hourly Dst data in place of USGS data. It’s the one and only other global geomagnetism project.
F4 and F5 tornadoes are obviously important to study but a secondarily helpful topic would be the most severe F3 outbreaks. The spawning of an F4 or F5 tornado doesn’t automatically entail that the parent storm was stronger than storms that spawned several F3s.
The data for F4 and F5 tornadoes during super-storm intensity disturbances is very small. Only one tornado is not enough for forming confident conclusions, highlighting the need for further research. Waiting for another couple hundred years of data may be necessary.
More in-depth research may be conducted using the available USGS minutely data22. Studying the trends of electromagnetic anomalies around F4/F5 tornadic times may also be fruitful. Often, large swings between relatively high positive Dst readings and big negative Dst readings occurred near or around F4/F5 tornadic events.
Frankly, I will need help analyzing the full significance of both Appendix A and Appendix B. Please feel free to use them in subsequent studies to help answer some of the last mysteries regarding why the world’s most intense tornadoes form.
DOCUMENTATION
- Love, Jeffrey J. “The Electric Storm of 1882.” Geomag.USGS.gov, USGS.gov, https://geomag.usgs.gov/research/featured/2018/elecstorm-1882/.
- “Solar Storm of 1859.” Wikipedia.com, Wikimedia Foundation, Inc., 9 April 2019, https://en.wikipedia.org/wiki/Solar_storm_of_1859.
- Homeier, Nicole and Wei, Lisa. “Solar Storm Risk to the North American Electric Grid.” Lloyds.com, Lloyd’s, 2013,
http://www.lloyds.com/~/media/lloyds/reports/emerging%20risk%20reports/solar%20storm%20risk%20to%20the%20north%20american%20electric%20grid.pdf. - “March 1989 Geomagnetic Storm.” Wikipedia.com, Wikimedia Foundation, Inc., 21 March 2019, https://en.wikipedia.org/wiki/March_1989_geomagnetic_storm.
- Patel, Kasha. “August Auroras Light Up North American Skies.” EarthObservatory.nasa.gov, EOS Project Science Office, 30 August 2018, https://earthobservatory.nasa.gov/images/92682/august-auroras-light-up-north-american-skies.
- “Bastille Day Event.” Wikipedia.com, Wikimedia Foundation, Inc., 11 March 2018, https://en.wikipedia.org/wiki/Bastille_Day_event.
- Zell, Holly. “Halloween Storms of 2003 Still the Scariest.” Nasa.gov, 27 October 2008, https://www.nasa.gov/topics/solarsystem/features/halloween_storms.html.
- Phillips, Tony. “Carrington-class CME Narrowly Misses Earth.” Nasa.gov, 2 May 2014, https://science.nasa.gov/science-news/science-at-nasa/2014/02may_superstorm.
- Balan, N., Tulasiram, S., Kamide, Y., Batista, I.S., Souza, J. R., Shiokawa, K., Rajesh, P. K. and Victor, N. J. “Automatic Selection of Dst Storms and Their Seasonal Variations in Two Versions of Dst in 50 years.” Earth, Planets and Space, SpringerOpen, 2017, https://pdfs.semanticscholar.org/8611/782eb3a32f3da1a6c1ae75243234ec08599f.pdf.
- Witze, Alexandra. “Earth’s Magnetic Field Is Acting Up and Geologists Don’t Know Why.” Nature, Springer Nature Publishing AG, 9 January 2019, https://www.nature.com/articles/d41586-019-00007-1?utm_source=fbk_nnc&utm_medium=social&utm_campaign=naturenews&sf205677010=1&fbclid=IwAR1p2QYVhdvch5W3DYQAY08Mxp
8y6N8wMMet4YxZw9CyU9X2J5MTI1tAbuY. - Geggel, Laura. “Earth’s Magnetic Pole Is Wandering, Lurching Toward Siberia.” Live Science, Live Science, 14 January 2019, https://www.livescience.com/64486-earth-magnetic-pole-moving.html.
- “List of North American Tornadoes and Tornado Outbreaks.” Wikipedia.com, Wikimedia Foundation, Inc., 24 April 2019, https://en.wikipedia.org/wiki/List_of_North_American_tornadoes_and_tornado_outbreaks.
- “Disturbance Storm-time (DST) Index.” National Geomagnetism Program, USGS, https://geomag.usgs.gov/plots/dst.php.
- “USGS Geomagnetism Program: Definitive Disturbance Storm-Time (Dst) Data.” ScienceBase-Catalog, USGS, 7 February 2019,
https://www.sciencebase.gov/catalog/item/5b34de04e4b040769c173f56. - “Real-time Internal (Ist) and External (Est) Storm Time Indices.” Cooperative Institute for Research in Environmental Sciences, University of Colorado – Boulder,
https://geomag.colorado.edu/rt-ist-est-storm-indices. - Love, J. J. and Gannon, J. L. “Revised Dst and the Epicycles of Magnetic Disturbance: 1958-2007.” Annales Geophysicae, Love and Gannon, 11 August 2009,
https://www.ann-geophys.net/27/3101/2009/angeo-27-3101-2009.pdf. - “USGS Geomagnetism Program: Definitive Disturbance Storm-Time (Dst) Data.” Sciencebase-Catalog, U.S. Department of the Interior – U.S. Geological Survey, 7 February 2019, https://www.sciencebase.gov/catalog/item/5b34de04e4b040769c173f56.
- “Disturbance Storm Time (DST) Index.” National Geomagnetism Program, USGS, https://geomag.usgs.gov/plots/dst.php.
- “Tornado Outbreak of February 28 – March 1, 2017.” Wikipedia.com, Wikimedia Foundation, Inc., 30 March 2019,
https://en.wikipedia.org/wiki/Tornado_outbreak_of_February_28_%E2%80%93_March_1,_2017. - “2011 Super Outbreak.” Wikipedia.com, Wikimedia Foundation, Inc., 16 April 2019, https://en.wikipedia.org/wiki/2011_Super_Outbreak.
- “Tornado Outbreak Sequence of May 21-26, 2011.” Wikipedia.com, Wikimedia Foundation, Inc., 5 March 2019,
https://en.wikipedia.org/wiki/Tornado_outbreak_sequence_of_May_21%E2%80%9326,_2011. - “USGS Geomagnetism Program: Definitive Disturbance Storm-Time (Dst) Data.” Sciencebase-Catalog, U.S. Department of the Interior – U.S. Geological Survey, 7 February 2019, https://www.sciencebase.gov/catalog/item/5b34de04e4b040769c173f56.
Back to West Coast Weather’s Blog